Revealing Data Profiling Secrets in Splunk
What Is Data Profiling?
Before you can make use of the data you have and trust its value for, analytic, testing, and other production jobs, you have to know enough about that data. Data that is incomplete, improperly linked, or improperly defined is an impediment to project success.
To address this issue, data profiling technology exists to parse data sources and report on their content, layout, and relationships.
How Do You Profile Data?
The IRI Voracity data management platform — or its subset products like CoSort, NextForm, FieldShield or RowGen — has functionality to statistically profile, model, and search flat files and database tables via data profiling wizards.
The wizards are accessed from a drop-down menu indicated by the microscope icon in the top toolbar of IRI Workbench, the graphical IDE built on Eclipse that front ends Voracity et al:(
So once you know what files or DB schemas you want to profile, you can use either the flat-file profiling wizard or the database profiling wizard to automatically detect the metadata and the format of the sources, and to choose those portions (or all) of the data to statistically profile.
In addition to those reports, the wizards also have options to search for values within the chosen repositories that match specified regular expressions or strings:
- Pattern Search – finds and counts values that match the format of a Java regular expression.
- Fuzzy Match – searches for strings similar to those you enter, and to select or specify search conditions using different algorithms and probabilities
- Value Lookup – compares values in the data source(s) to every string in a set file, showing and counting the matches.
The database profiling wizard also runs referential integrity checks. And, another wizard creates both entity-relationship (ER) models and diagrams to illustrate the structure and relationships of tables in any RDB schema you want to examine.
Now What? Splunk of Course.
All of these data profiling statistics and values are output to a structured file like this:
These flat files can be easily loaded into tools like Splunk for more a more visual analysis, and possible adaptive responses (actions to take). To make that happen automatically, check out this article on utilizing the Splunk Universal Forwarder with IRI software output.
Indexing those Results in Splunk
I used Universal Forwarder to push the tab separated values file created by the database profiling wizard in IRI Workbench to Splunk Enterprise from my local computer.
Once the file is indexed in Splunk, the data can be searched and used to make visualizations. Go to the Search and Reporting app in Splunk Enterprise, and find your data source(s) that have been indexed. Once the source is selected, a screen like this should appear:
This gives you a look at the entries of the data profiling results. If you are dealing with many database tables or schemas, creating dashboards will give you a faster way to visualize the relevant results of the data profiling operation.
Seeing Key Data Profiling Details
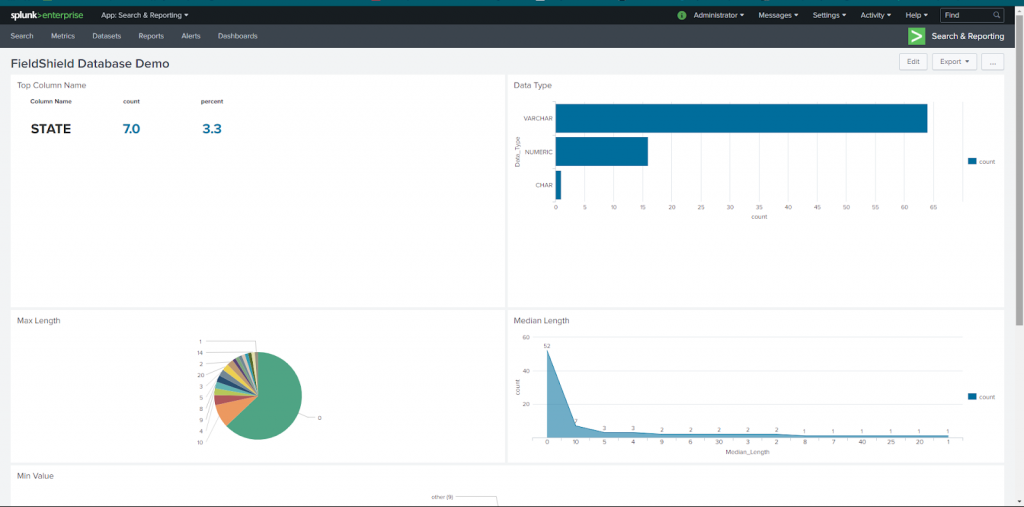
Using Splunk commands, I was able to construct a dashboard that lends more graphical insight into the data profiling results. Some of the important concepts of data profiling are structure discovery, content discovery, and relationship discovery.
In this dashboard, I can see that the main data types are varchar and numeric, which seem to be consistent with the many min and max values presented in the charts below. So, the structure of this data set appears to be fine.
In terms of content discovery, we find out that the top column name of all of the databases included in this data profile is State, with a share of 3.3 percent of columns. However, we also find that the median and max lengths of the data values is heavily represented by 0, meaning that there are a lot of null or empty values.
Finally, we see from the visualizations that most of the data from different databases is unrelated, which is true in this example.
From what has been discovered in the database profiling results in this example, the data tables in the databases should be filled out more if analyzing the data from the aforementioned databases is your objective. Also, data from different databases should be indexed separately into Splunk since the data is unrelated.
Bottom Line
Data profiling helps you understand the data you have, make sure it is healthy, and gives you ideas for making the best use of it. Ultimately, data profiling improves the productivity and effectiveness of data governance and analytics.
The use of data profiling tools in IRI Workbench can be combined with analysis and visualization tools like Splunk to improve insights into the makeup of your data. If you need our help using the profilers, or getting their results into Splunk, email voracity@iri.com.


