Feeding Datadog with Voracity Part 3: Collecting and Leveraging…
This article is third in a 4-part series on feeding the Datadog cloud analytic platform with different kinds of data from IRI Voracity operations. It focuses on visualizing Voracity-wrangled in Datadog. Other articles in the series cover: relative data preparation benchmarks, wrangling and feeding data to Datadog, and using DarkShield search logs in Datadog security analytics.
In the previous article of this 4-part series, I demonstrated how to prepare data in Voracity and prepare Datadog to consume it in real-time. In this article, I will show how to collect and use Voracity-prepared “log” for Datadog visualizations and alerts. That ‘log’ is the resulting dataset (Voracity target) of the same UK company data mentioned in the first two articles.
Leveraging Voracity Data in Datadog
The SortCL program powering IRI CoSort data manipulations and other IRI Voracity platform operations — like DW ETL and reporting, NextForm data migration, FieldShield data masking, and RowGen test data generation — can process data from many sources and formats.
SortCL can sort and join one or more tables and files for example; apply filtering, masking, cleansing, and data transformation logic; create detail and summary reports; and, synthesize test data.
In all cases, SortCL results can manifest in multiple targets and formats at once, including JSON and XML. Coincidentally, Datadog automatically parses JSON and XML files, which it calls logs.
To collect Voracity target output as “logs” into Datadog, first ensure that the Datadog agent is running. You can do that by executing the command ./agent status from the bin folder of the directory that the Datadog agent was installed.
Execute jobs in Voracity from IRI Workbench or the command prompt, ensuring that the job target writes to the directory you specified for logging. When the job finishes, Datadog will immediately send the file(s) for logging.
Once that data is in Datadog, and any facets of the data have been specified based on extracted attributes, you can work with and visualize the data.
Datadog Log Explorer
The logs ingested into Datadog can be queried to find specific data. In this example, I queried the UK company data file wrangled by SortCL for all companies starting with “YORV” that are private limited companies located in North Yorkshire.
The syntax for that query is as follows:”YORV* AND Private Limited Company AND North Yorkshire”. This is just a simple example of the Datadog search syntax:
Visualizations, Dashboards, and Alerts
As stated in the prior article, all the attributes extracted from the logs must be added as facets to be able to be used in visualizations and analytics. Once facets have been added, Datadog users can take advantage of rich visualization and analytical capabilities.
Here is an example of a table metric generated by Datadog of UK Company data after attributes have been extracted from the Datadog logs, and facets have been applied:
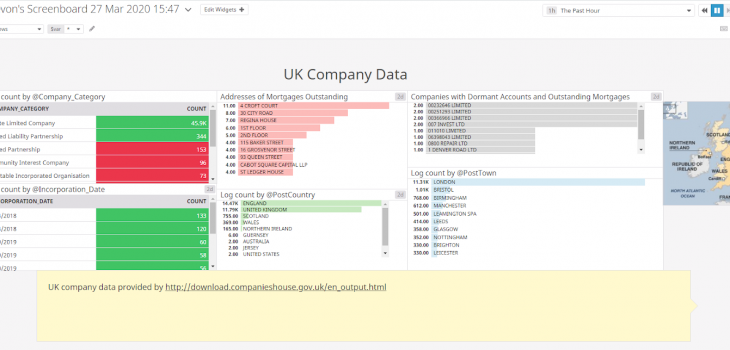
Facets can also be used to create visualizations, such as charts and graphs. Visualizations can be combined in a dashboard to create a single view of information. Dashboards can be customized in many ways, with different colors, time ranges of data, and many panels to choose from, including custom text and images.
Here is an example of a Datadog dashboard visualization of that UK company data that I had pre-processed in IRI Voracity, and which Datadog had collected in real-time:
Datadog Alerts
Datadog can also send alerts when certain values are detected in specified logs. Notifications can be sent by email, or via the integrations below.
Alerts are set up by creating a monitor. Monitors can be set to trigger when certain thresholds or values are reached. Then, alerts can be sent through email, Google Hangouts chat, Slack, Microsoft Teams, and several other tools. No matter how you stay in contact with information, Datadog can alert you.
In a possible sample alerting pipeline, data could be generated, then automatically pre-processed by a batch script running on a schedule that generates a SortCL script based on file name and calls SortCL to run that script.
The result of the script is outputted as a file to a certain directory that is set up to automatically log to Datadog. Then, once the logs have been intaken by Datadog, an alert will be sent out if a certain value is detected, over/under a threshold, etc.
Examine Voracity’s capabilities and Datadog’s documentation to appreciate more of what these combined technologies can do to speed business intelligence and data security pipelines.
In the next and final article of this series, I will be working with data from another Voracity component, IRI DarkShield, which finds and masks PII in unstructured sources. Datadog can ‘eat’ DarkShield search logs (.darkdata files) to create visualizations and alerts that can help companies in their battle to improve data security.


