Feeding Datadog with Voracity Part 4: Security Analytics from…
This article is the fourth in our 4-part series on feeding the Datadog cloud analytic platform with different kinds of data from IRI Voracity operations. It focuses on visualizing search logs from the DarkShield unstructured data masking product (also a Voracity component) in Datadog for security analytics. Previous articles in the series cover: the speed advantage of wrangling data in Voracity for Datadog, how you stage and feed Voracity BI data to Datadog, and visualizing that wrangled data in Datadog.
In the prior articles of this series, I demonstrated the acceleration of Datadog visualizations by wrangling data in the external IRI data processing program called SortCL. SortCL performs fast data manipulations for IRI CoSort and other jobs in the Voracity big data management platform.
Beyond CoSort and among other component products in Voracity is IRI DarkShield for finding and masking sensitive data (e.g., PII) in semi-structured and unstructured data sources. In this article, I will show you how Datadog can also be logged with DarkShield search results for the purpose of ‘security analytics.’ Compare this to what I demonstrated with Splunk in this article.
Using DarkShield
DarkShield was built to discover, deliver, and delete sensitive data in many ‘dark data’ sources, including: unstructured text files, including logs and emails, as well as semi-structured files like JSON and XML, plus PDF and MS documents, image files, NoSQL DB collections, and even RDBs and flat-files where PII may exist in random locations (i.e., float) within fixed columns.
Indeed in this example, I will use DarkShield to search for sensitive data in the same UK company data CSV (.csv) file I used in previous articles in our Datadog series. Note that I could also use an IRI FieldShield data discovery wizard like Flat-File Profile or Directory Data Class Search in IRI Workbench to find sensitive data in CSV fields, but those don’t find floating PII.
So, I launch the DarkShield “Dark Data Search/Masking Job” wizard IRI Workbench instead:
When the wizard opens, I specify the directory of my input, the type of files (in this case, CSV), the directory of output. This should be a directory monitored by Datadog for .darkdata files to log. See article 2 of the series for more details on setting up logging with Datadog.
Next, set up Data Class matchers to discover exactly the types of sensitive data you want to find in DarkShield:
Then, run the .search file the wizard produced (as an IRI search job) to actually discover the sensitive information you classified; i.e., the items and their search methods defined in data classes and specified in the DarkShield job configuration.
DarkShield Search Results
Running the .search file produces a .darkdata file. It is an XML report and tree view of the search results. It contains information about the sensitive data that was found — what it was (the class of data), where it is (its source file), and the search matcher (method) that found it:
Datadog can be used to more graphically illustrate this information to help data security analysts visually peruse the types and location of sensitive data DarkShield’s search detected.
To begin, make sure that logging has been configured correctly, as described in the second article of this series. In the conf.yaml file that was described in that article, ensure that the path is set to the directory you will want to monitor, then add “*.darkdata” to the end. This specifies that all .darkdata files will be logged to Datadog.
Since .darkdata files are in XML format, Datadog will automatically parse them, and there is no need to create a pipeline and custom parsing rules.
This is a sample of the conf.yaml I used to collect .darkdata files from a specified folder. The log_processing_rules is an additional setting in this file used to specify logs as multi-line:
Once the .darkdata file has been logged, new dashboards can be created, or edited from the current dashboard list. These options are available under the “Dashboards” menu in the Datadog web interface.
There are many widgets available to design dashboards with. These include free text, time series graphs, query values, tables, top lists, images, log streams, and more.
See the image below for some of these options. Note that not all of them are specifically suited for logs, as some only allow for values collected by Datadog regarding system and infrastructure metrics.
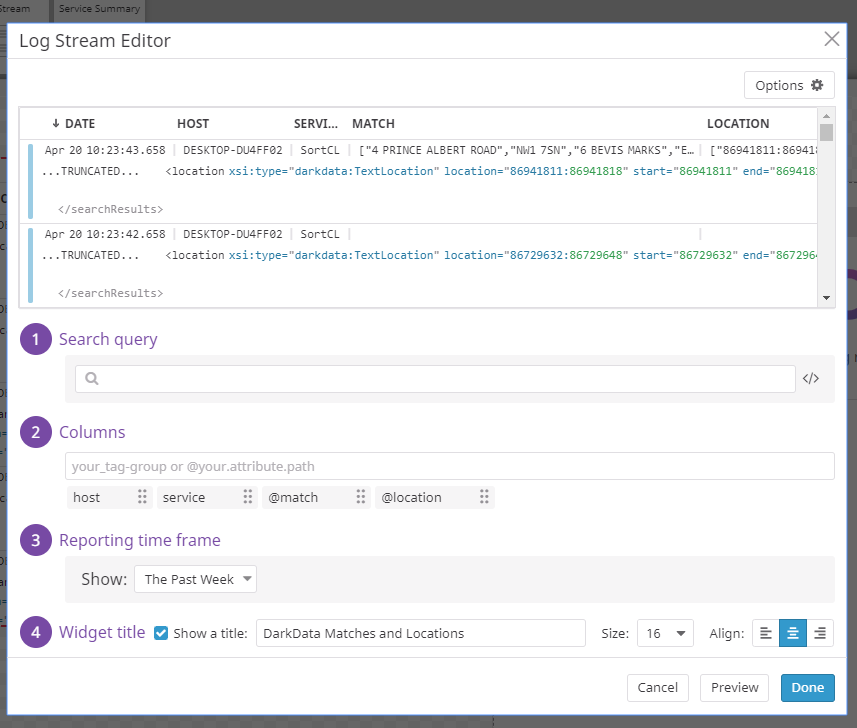
Clicking on one of the widget options in the menu will bring up an editor that allows you to design and customize the visualization. Here, I clicked on the log stream widget. This allows you to narrow down results with Datadog’s search functionality.
Columns (from facets, similar to the concept of fields) can be selected as well from this editor. The time range of logs to base the visualization off of, the optional title for the visualization, and design formatting can all be specified from the editor and previewed:
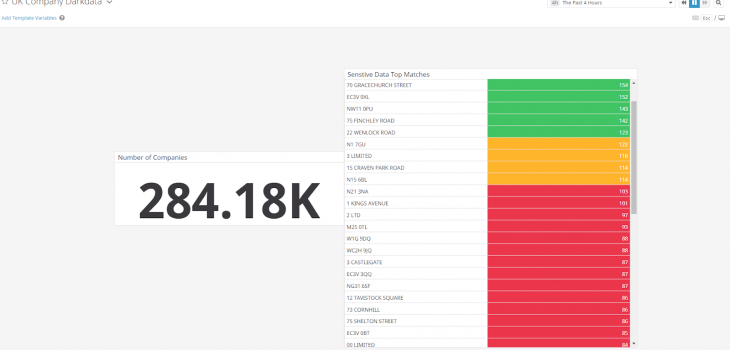
I used the .darkdata results of the UK Company Data file mentioned earlier to create a dashboard depicting how many sensitive data matches were found, and what were the most common matches.
Data Dog Security Alerts
Once your DarkShield search results are in Datadog, you can also set up alerts that get triggered when certain thresholds are reached. For example, you can tell Datadog to send an email when it sees more than 100 values belonging to a particular data class, or if there is a particular value, or are a certain number of them, as revealed in the DarkShield .search file.
Datadog supports a number of different communication protocols:
Alerting to one of these protocols is specified using the format:
@<INTEGRATION_NAME>-<VALUES>
Different alerts can be sent depending on the severity of the warning. Also, when specific values are matched, special alerts can be sent. Datadog alerts are discussed in detail within the Datadog documentation, and are a powerful way to act upon events hidden within raw data.
Conclusion
Datadog can thus be part of the IRI DarkShield operational pipeline to create a comprehensive, real-time system for visualizing and acting on sensitive data in a wide range of on-premise or cloud platforms and applications. Together, these products reveal where various classes and ranges of data are, and when DarkShield should actually mask them.
If you have any questions about the use of DarkShield or any other data-driven operation that can feed Datadog, please contact voracity@iri.com. Click here to return to the start of this series and here for the previous article.


