Voracity Data Munging and Masking App for Splunk
In Q3’19, IRI created a new, free app for Splunk Enterprise and Enterprise Security users that seamlessly indexes data from any Voracity platform data wrangling or protection job. The app — available on Splunkbase — is the modern successor to the 2016 Voracity add-on to Splunk, and an alternative to using Splunk Universal Forwarder to index the data.
The app functions as an invocation and integration point for the execution and use of different SortCL-compatible jobs and their results; i.e.,
- IRI CoSort data cleansing and transformation
- IRI NextForm data migration and replication
- IRI FieldShield PII discovery and de-identification
- IRI RowGen test data synthesis and population
The app launches these existing jobs — usually created graphically in IRI Workbench, an IDE built on Eclipse — and automatically ingests and indexes the output data from those jobs into Splunk. From there, the data is ready to perform advanced analytics, apply visualizations or execute automated actions in Splunk.
The app works by running any specified IRI job script as a modular input given its specified location. It also accepts and executes additional SortCL command line arguments to the script, such as /WARNINGSON, /STATISTICS, or another named /OUTFILE target. The data flowing to Splunk through the app should be specified in a structured format like CSV, XML or JSON.
Installing the IRI App for Splunk
There are two options to install the IRI app:
- Download the app from Splunkbase and install it via the “install from file” button within your Splunk instance
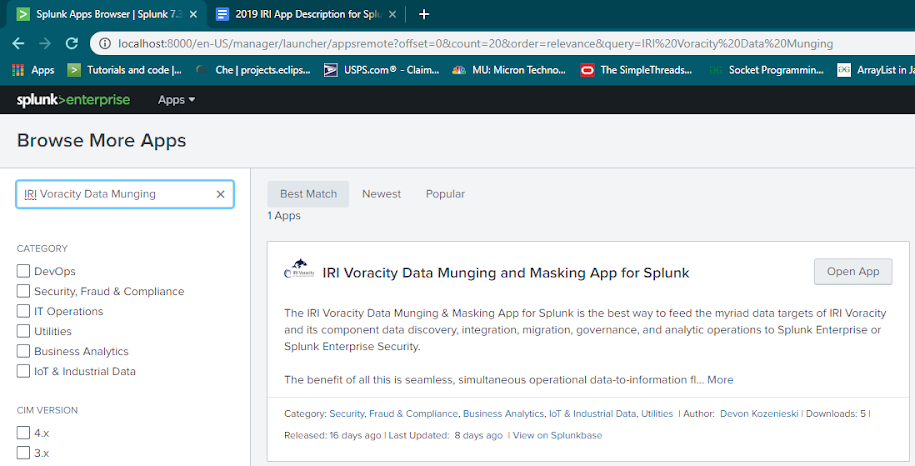
- Search for “IRI Voracity Data Munging and Masking App for Splunk” and have it installed directly.
Creating Data / Modular Input
The input to Splunk is the output of a Voracity job. The first /OUTFILE target in that job must be set to stdout for the data to be indexed into Splunk. Additional SortCL command line arguments can be specified in a modular input1, including more /OUTFILE= sections that define other targets beyond the data piping into Splunk.
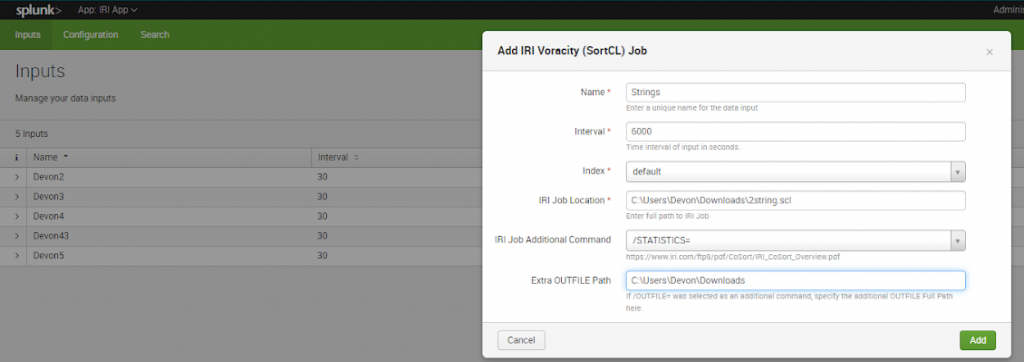
To create a modular input, select the Voracity app from the dropdown menu in the upper-left corner of Splunk. “Inputs” should be the default page of the app. To create an input, select the “Create New Input” button and select the IRI Voracity (SortCL) Job to run, which will produce the input data for Splunk.
Enter a unique name for the data input (without spaces). Set the interval and index location for the data input.
The interval indicates how often the modular input will be run. The modular input involves invoking SortCL from the command line with a specified IRI Job location and any other specified additional command line arguments. The index selector specifies what index the data will be stored in. The IRI Job Location field must be filled with the full path to the IRI job (.*cl file).
Additionally, seven different command line arguments can be added to the Modular Input to be run. These commands include /STATISTICS=, /WARNINGSON, /WARNINGSOFF, /DEBUG, /RC, /MONITOR=, and /OUTFILE=. Background on the SortCL program and its syntax can be found in the CoSort overview booklet.
An extra file path must be specified if a command ends in ‘=’. This field should be left blank if no command is selected or a command that does not end in ‘=’ is selected.
Finally, click the “add” button at the bottom of the dialog. The name of your new input (*.scl job script file) should now be listed in the data inputs table.
Searching the Results
To search the results now available in Splunk, select “Search” from the navbar of the IRI App. Type “Source= “name_of_modular_input_type://modular_input_name”” to search the data indexed by the modular input.
This can also be accessed by clicking “Data Summary” and selecting the source from the “Sources” menu. Use Splunk commands such as |stats, |chart, and |timechart to help visualize your data. See this article for a prior example.
Visualizing the Results
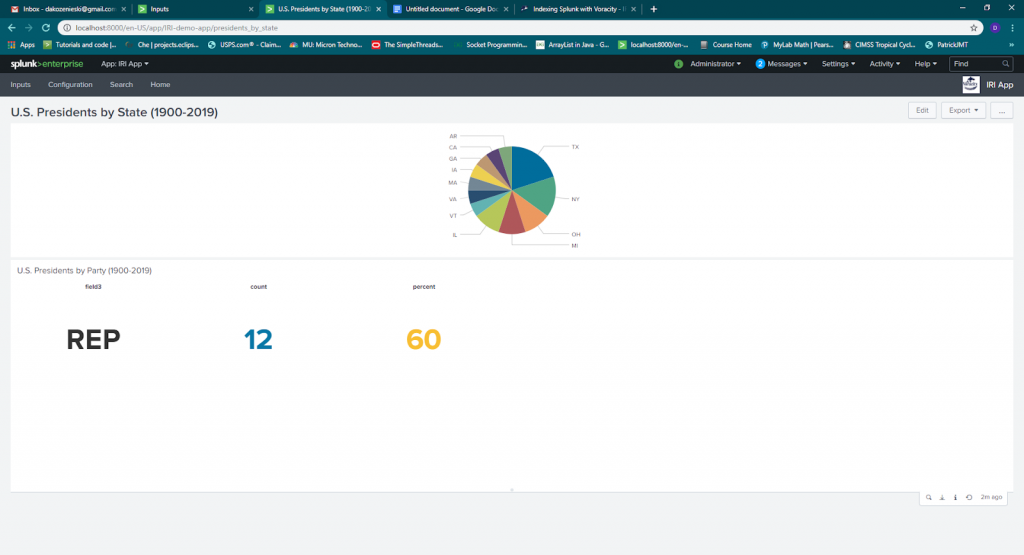
Here is an example of U.S. president data from 1900 onward sorted in a simple CoSort SortCL job, and then indexed and visualized by Splunk:
Actioning the Results
In addition to visual analytics, you can also utilize the Adaptive Response Framework in Splunk Enterprise Security, or a playbook in Splunk Phantom, to take action on production or log data prepared in Voracity across a wide range of industries and applications.
Examples would be wrangling customer transactions for Splunk to flag for promotion and pricing decisions, and MQTT or Kafka fed sensor data aggregated (and anonymized) by Voracity for Splunk to use in diagnostic or preventive alerts.
Contact voracity@iri.com if you would like help building out data preparation, presentation, and prescriptive scenarios using Voracity and Splunk.
- Modular input is a way to get data into Splunk. The IRI Voracity Data Munging and Masking App for Splunk uses modular inputs to get data produced by SortCL jobs into Splunk. In this modular input, an App user can specify things like the location of the SortCL job, additional SortCL commands, and the time interval to run the modular input.


