Bloor Research on Data Classification in IRI Voracity
IRI Voracity is a data management platform that we have previously talked about at some length. It offers capabilities for data integration, data governance, data masking, test data management, data quality, data cleansing, data migration, and so on (and on, and on). But it’s important to remember that many – if not all – of these activities rely on being able to classify your data, most prominently to locate the sensitive data that you will need to protect via your data governance, masking, and security processes.
Data classification also provides more general visibility into your data, which is generically useful for understanding your data but especially so if you need to identify particularly important data assets, as may be the case during (or rather, prior to) data masking or migration. With this in mind, it is both expected and appropriate that IRI Voracity provides a robust data classification system, designed to help you profile your data and find (then subsequently anonymize) sensitive data.
Specifically, Voracity allows you to define a selection of data classes for your system, with a default set (including commonly used but generic data classes like name, email, credit card number, and so on) provided automatically for each Voracity project that you can then customize and extend. A number of built-in privacy regulations (GDPR, CCPA and what have you) can also be used to automatically generate the data classes applicable to them.
Data classes can be grouped together, and data class groups can be categorized further by assigning them specific sensitivity levels and/or associating them with one or more of the aforementioned regulations. Data classes can also be given a priority level, which determines which class takes precedence if a given data asset seems to fit into multiple categories at once.
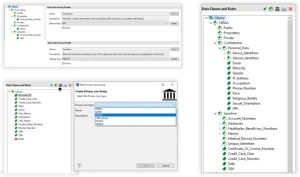
Data class and rule library in the IRI Workbench GUI for Voracity
You can then search your system for data that falls into each data class. Search methods are attached to each data class, and a variety are available. This includes (but is not limited to) pattern matching, both strict and fuzzy data matching (using a preset list of associated values), column name matching, path matching, cell matching (for spreadsheets), and named-entity recognition based on Apache OpenNLP, PyTorch, or TensorFlow. The latter is particularly notable for leveraging semi-supervised machine learning to improve its efficacy.
Note that some of those methods are only applicable to structured/semi-structured data (specifically, the ones which only make sense where there is a structure, like column name matching – you can’t match based on column name if there are no columns). Some are only available in IRI DarkShield (the semi/unstructured data masking product in Voracity), not IRI FieldShield (such as named-entity recognition, cell matching and fuzzy matching), again due to their inherent source-oriented technologies. Both tools do however share the data classes themselves and much of the data classification functionality that is available.
Data classes can also have multiple search methods attached to them in order to make the matching process more accurate and produce fewer false positives. There are also considerations made for the sake of performance – tables that have already been scanned will be skipped during repeated discovery phases, for instance, and you can choose to exclude specific tables or data classes from the discovery process entirely.
In addition to these search methods, data classes can be paired with any of the anonymization methods available in Voracity, whether that means masking, redaction, encryption, or whatever, which will then be applied to any data that is subsequently sorted into that data class. This allows the product to essentially automate both the discovery and protection of your sensitive data through its voluminous collection of data masking (and other data security) rules. Notably, deterministic masking rules maintain the consistency, and thus the referential integrity, of your data.

Above the fold in an IRI DarkShield discovery report
Finally, this classification information is automatically aggregated and organized into an HTML report. This report is highly visual, prominently displaying various bubble and pie charts that highlight your top sources of sensitive data, your most common data classifications, and so forth. Various aspects of this report can be customized before it’s generated, such as the scale (either linear or logarithmic) it uses to create its leading bubble chart. You can also export your results to a third-party product, such as a dedicated visualization or analytics tool (Splunk, for instance), via an API.


