Data Consolidation Wizard for Data Quality
Given the amount of data businesses garner daily from human interaction, it is easy to understand how their sources become rife with redundant or erroneous entries. For the sake of data quality and efficiency, master data management (MDM), and improved customer experiences, data architects are interested in a single, standard representation of their data.
If “John Smith” is entered into a sales database, for example, and later he is entered again as “Jon Smith,” there will be two instances of the same person. As this occurs many times with many different customers, the database gets clogged with redundant data, and processes like profiling, querying, and loading are slowed down. Beyond that, customer service representatives and other stakeholders in the business will not have a reliable view of the customer, misidentifying them, sending multiple catalogs to their home, etc.
In short, data unification is important to the continued health of your data and your business.
Source: Tata Consultancy Services
IRI Voracity users can access a new Data Consolidation wizard in IRI Workbench to identify and correct redundant records in files and databases. The wizard accepts the following data formats as inputs: CSV, Delimited, LDIF, ODBC, or XML.
Source Selection
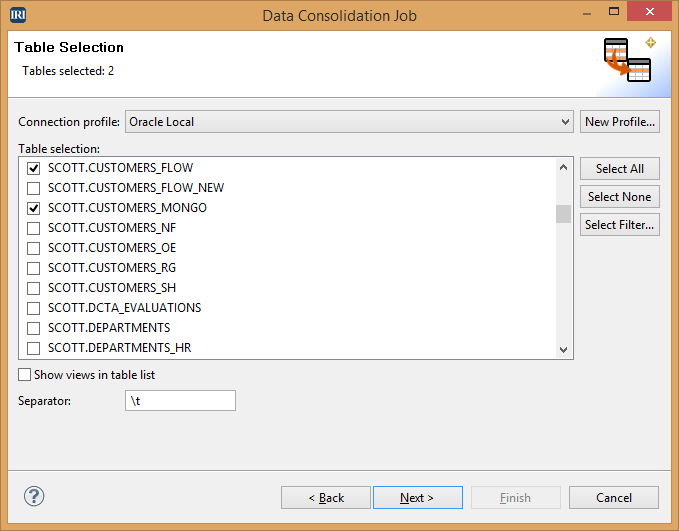
After designating the location of the project on the setup page, the first part of the wizard involves source selection. If your sources are only tables in a connection profile, you can check the appropriate checkbox.

Selecting this box and clicking Next opens an input page like the one below where you can choose the tables to be included:
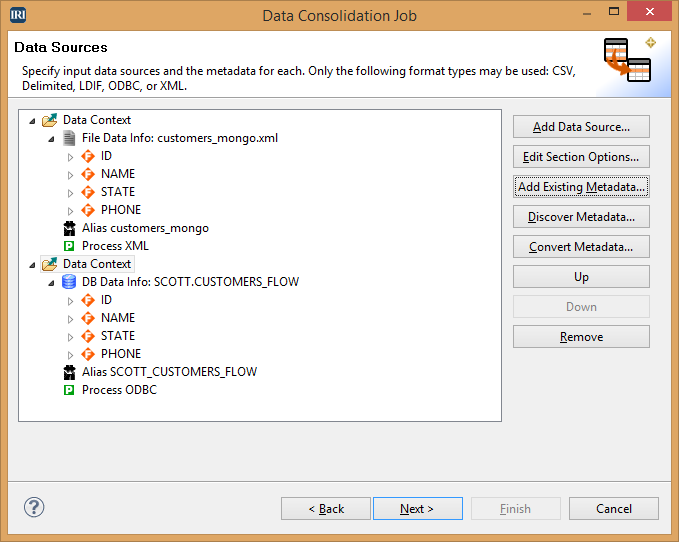
If the checkbox is not selected, you can add files or ODBC sources in the same input screen. On this type of input page, you will also need to add the metadata for each source. In this example, there is an XML file and an Oracle table added.
Once you have added the desired sources added, click Next.
Create Output Fields
This page allows a choice of which fields will be part of the output. Drag and drop the desired fields from the Input Field List to the Output Field List. For example, to create a new customer table to have master IDs and names, you could select just the ID and Name fields. To use all the fields for a particular source, select the data source name and drag it to the Output Field List.
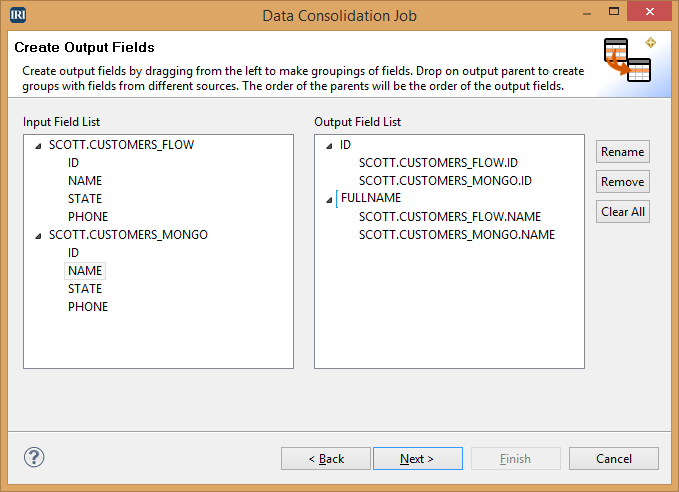
You can also rename the output fields here by clicking Rename or double-clicking the parent field and then clicking another item in the tree to save it. Once all the desired fields are in the Output Field List, click Next.
Create Grouping Methods
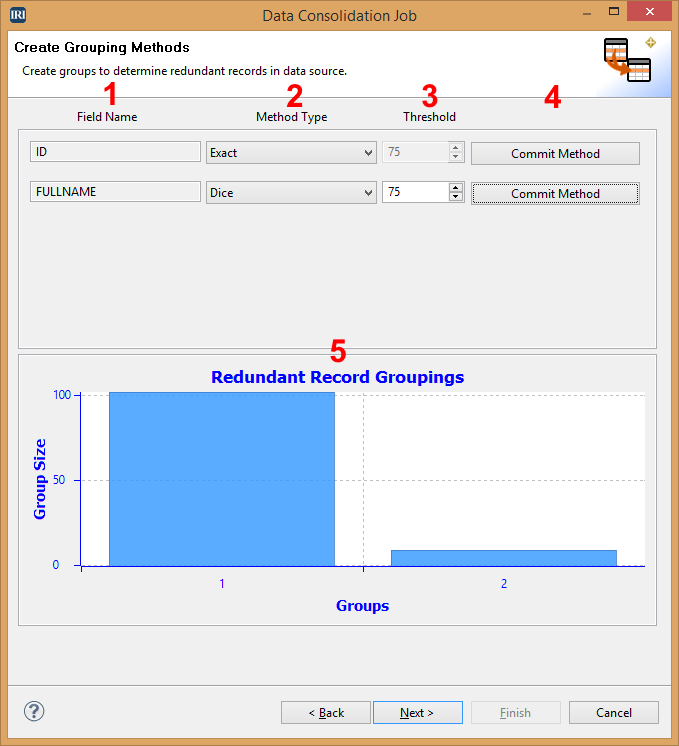
Here you create and commit grouping methods the wizard will use to determine if your data has redundancy. This page will also display a bar graph displaying the redundancy groups your data contains.
- Displays the name of the field in your output file.
- Select the matching type for redundancy comparison.
- Activates if a fuzzy comparison option is selected for the matching type and allows you to select the threshold for the fuzzy comparison.
- Commit the corresponding method.
- Redundancy grouping graph.
Each field created on the previous page will be displayed on this page to allow you to select a grouping method. An example would be:
- To check for potential redundant records in customer tables, select an exact match for ID and an approximate match for Name.
- For matching, choose between Exact, Dice, Levenshtein or leave the field blank.
- The Exact option checks if both fields are exactly the same.
- Dice divides words into character pairs and compares the number of similar pairs in both words. It is faster than Levenshtein but is less accurate in smaller words.
- Levenshtein compares two words and counts the shortest distance to edit one word into the other. This is useful for spelling mistakes and common typos, but is the slowest.
- Leaving the matching field blank will mean no grouping is performed on the data.
- Once you set all the options for a method, select Commit Method and the method will be applied to the data. This process can take time depending on the size of the data source. Once it is complete, the graph will update, showing the different groups and number of conflicts in that group. In this example, there are 111 records with no conflicts and another group where 9 records conflict.
Once you have all the methods created and committed, click Next. See our prior article on fuzzy matching algorithms to see their users through data-centric examples.
Resolve Conflicts
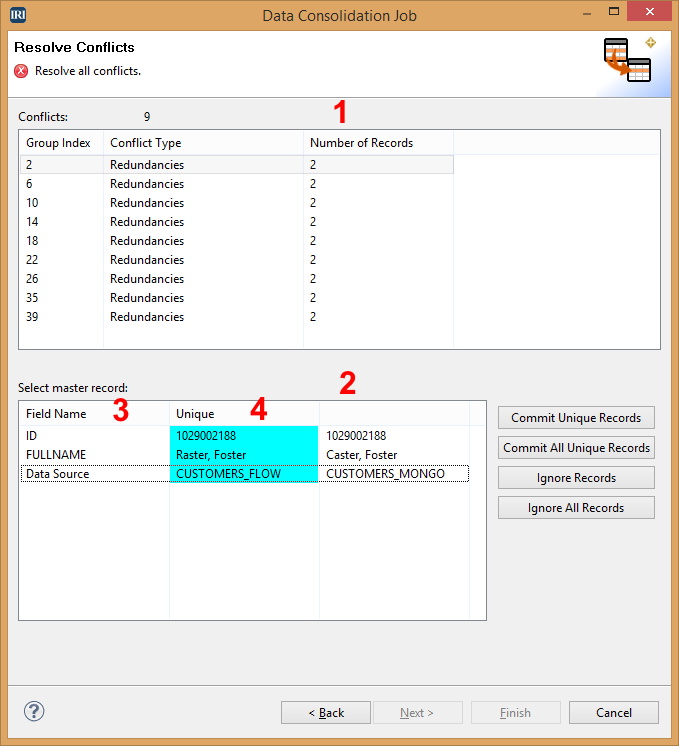
This page displays the conflicts in your output, so you can choose the record that is the best representation of the (master) output data.
- Displays all conflicts in your data source.
- All conflicting records in the group.
- Field names of the data in the conflict including the data source.
- Record selected as the unique record.
For each item in the Conflicts list, you must choose one or more of the conflicting records to be a unique record:
- Select an item in the Conflicts list to populate the bottom table with the field names and conflicting records.
- For each record that represents a different data entity, select to mark it as unique. To undo, click the record again and it will be unmarked as unique.
- Once you are sure that you selected all of the records that should be unique in that group, select Commit Unique Records. This will save those records and prevent the others from being added to the output.
- If you want to save all the unique records found, you can select Commit All Unique Records. This button is handy when using the Exact method and you want to save all unique occurrences.
- If you want to ignore a set of records, you can click Ignore Records and that group of records will not be saved.
- If you want to ignore all conflicting records, you can click Ignore All Records.
You must repeat these steps for each item in the Conflicts list (unless you selected either of the All buttons). Once it displays that there are no more conflicts, click Next.
Target Selection
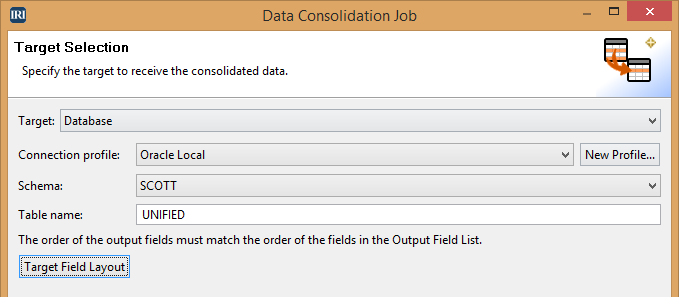
Select the type of target for your united data: either a database or flat file. If a flat file is chosen, enter the name and type of file (either CSV or XML).

If sending the output to a database, enter the applicable information in Connection profile, Schema, and Table name. The table must not already exist. Then, click Target Field Layout to fine-tune the details of the fields in the new table.
Once you have the details entered, click Finish. Your unified data will then be created from the wizard to your chosen target, ready to use.
Sample Input and Output
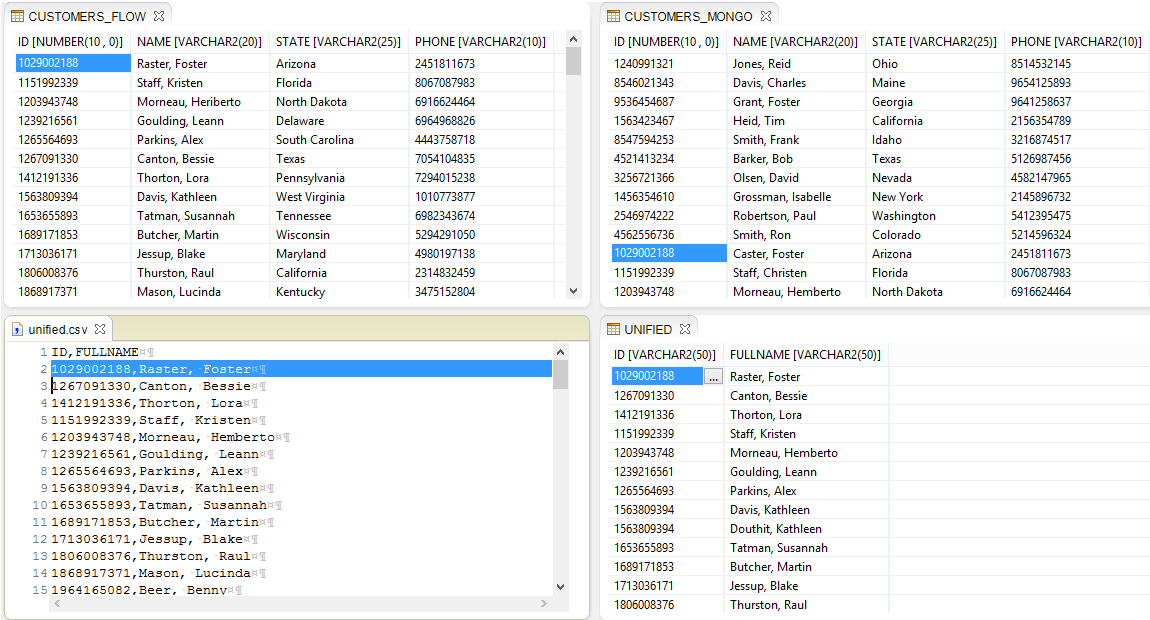
In this screenshot, the two input tables are shown at the top while a flat-file and table version of the output is show at the bottom. All names that were misspelled between the original tables have been reconciled in the wizard so that only one “golden record” name for each ID is added to the output.
